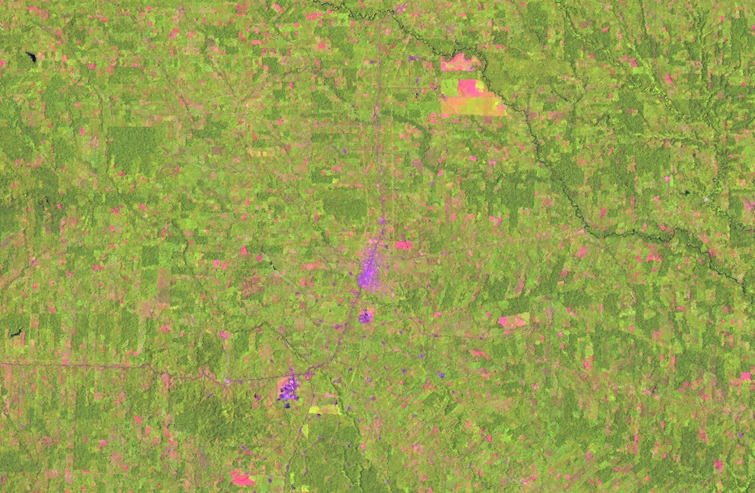
Remote sensing is the backbone of the spatial analysis in this project. We currently have a 30-year time series of Landsat imagery for this region, spanning 1973-2002. We have also recently begun acquiring a collection of high-resolution IKONOS imagery for select locations in the study area. The Landsat MSS (Multispectral Scanner) and TM (Thematic Mapper) imagery provide us with a wide view of the entire region, allowing us to track broad changes in LULC, while at the same time providing us with a fairly detailed view of changes internal to our study fincas. The 79m resolution of Landsat MSS and 30m resolution of Landsat TM imagery makes it possible to detect areas as small as 0.6 ha and 0.1 ha, respectively, although we tend to focus on a minimum mapping unit of 0.5 ha. Since late 1999, the acquisition of Landsat 7 ETM (Enhanced Thematic Mapper) with the addition of a 15m panchromatic band to the standard compliment of multispectral bands allows even more detail to be garnered from these region-wide images.
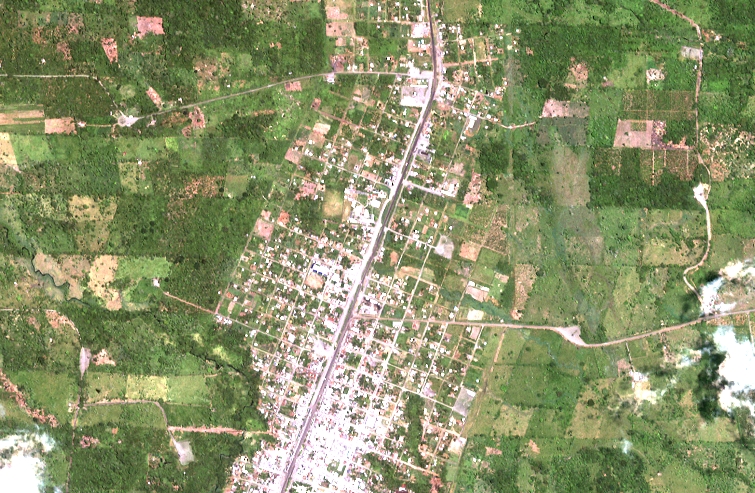
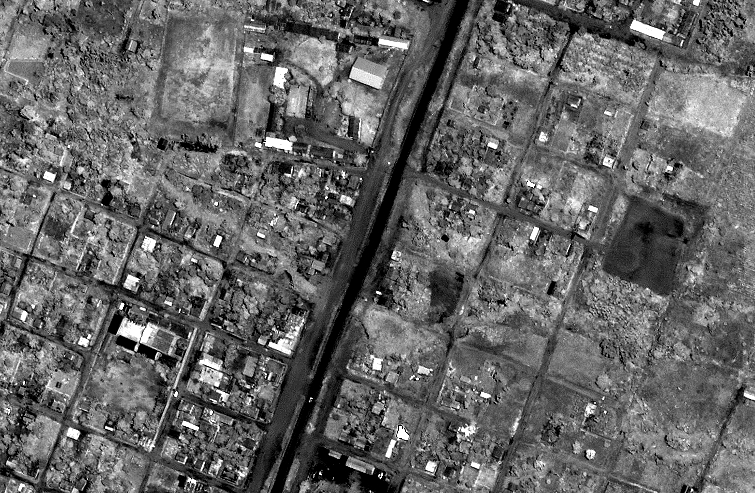
 By comparison, the IKONOS imagery (4m multispectral, 1m panchromatic) allows for extremely detailed viewing and analysis, albeit over much smaller regions. A typical IKONOS image covers roughly 120 km2, while a typical Landsat TM image covers 34225 km2. However, the improvement in spatial resolution more than makes up for the significant decrease in areal coverage.
The primary purpose of the Landsat time series is to track changes in land use and land cover (LULC) over time. Through the use of a supervised classification methodology, the LULC for each of these time periods can be generated. The classes of interest vary between the NASA projects in the colonist area and the NIH project in the indigenous area. More detail on the LULC classification methodology will be posted in the near future.
After the LULC classifications have been generated for each date of interest, the LULC history can be tracked for each sampled finca madre in the colonist study area, or for the chacras used by each indigenous household. These LULC histories are combined with the socio-economic and demographic (SED) data in multivariate analyses that are designed to evaluate the SED determinants of LULC change.
Another useful product that has been generated is the change detection. Several approaches have been used to look at how the LULC has changed over time. The most common method is the post-classification change detection, in which the LULC assigned to each pixel is tracked through time. However, there are a variety of pre-classification change detection methods that have also been performed. More information on change detection and other methods will be posted in the near future.