Two products that came out of the NASA-1 household survey in 1999 are the survey instruments and the sketch maps.
Survey Instrument Image Maps
The Survey Instrument Image Maps, or SIIMs, were produced prior to the beginning of the fieldwork. These SIIM products consisted of both small- and large-scale maps that were used to locate the sample farms, or fincas, from the original 1990 household survey.
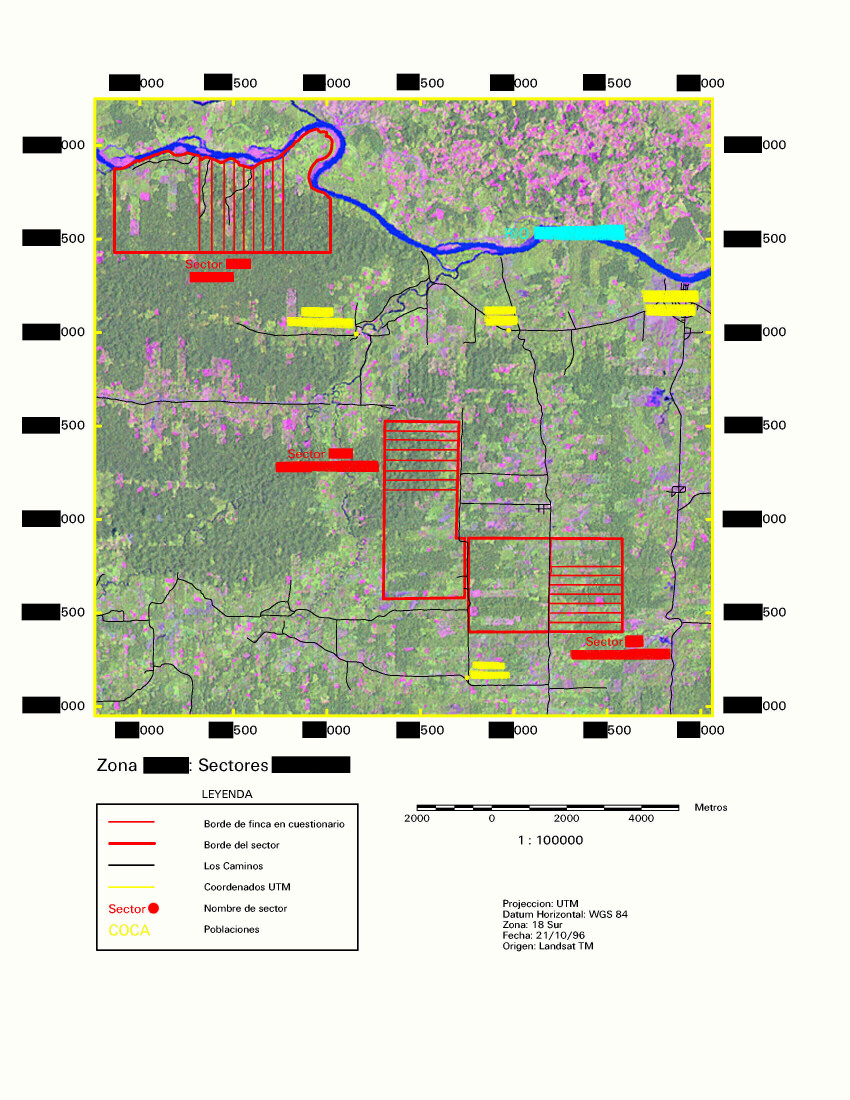
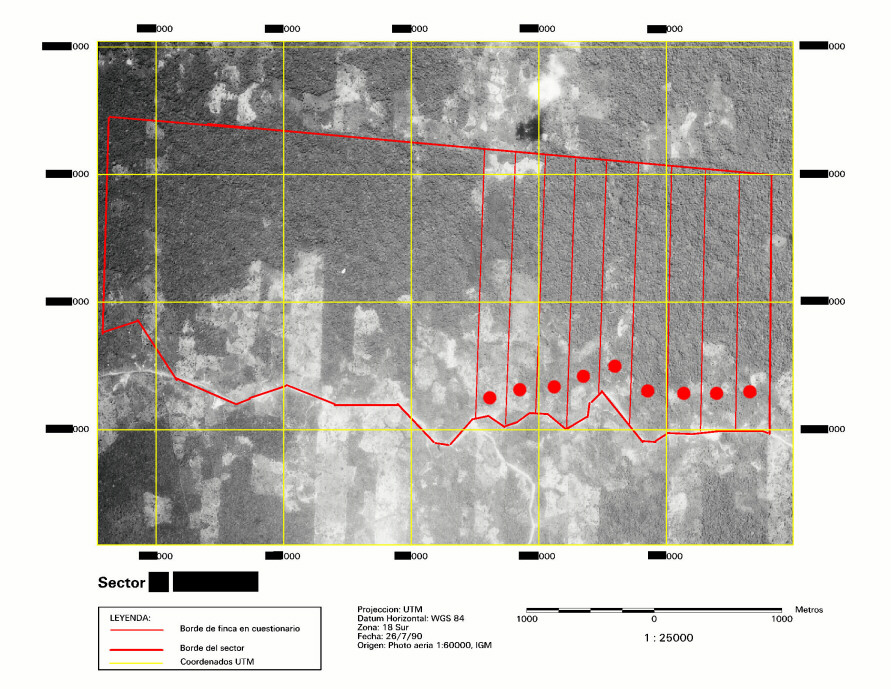 The challenge in creating the SIIMs was in locating the original survey fincas on the satellite imagery, and then on the scanned air photos. There were only two available information sources that provided any insight into the finca locations: 1) a set of poorly drawn sketches from the 1990 survey; and 2) inaccurate small-scale reference m
aps of the region, produced by the defunct government organization IERAC, showing the location of each sector. Therefore, the process of locating the fincas began by finding the sector of interest on th
e IERAC map and then finding its general location on the satellite image. This was a challenge, as the IERAC maps were not created by a cartographer and the geographic coordinates on the maps were poorly identified. This left the road network and rivers as the best means of locating the bounds of the sectors. Once a sectors location had been identified and delineated, it was necessary to locate the survey fincas. This is where the 1990 survey sketch maps came in. There was only one sketch per sector, in which the numbers and general location of the fincas were drawn. However, the sketches were not very detailed, oftentimes having the sector outline faintly resembles the sector outline on the IERAC map, and not being oriented with north up.
All of these issues translated to a certain level of uncertainty in the locations of the sample fincas on the SIIM maps. However, the SIIMs were accurate enough for the survey teams to navigate to the correct sector, and then using a combination of the UTM graticule (the yellow grid) on the SIIM, the finca number, and the surname of the owner in 1990, each sample finca was located.
Sketch Maps
The sketch maps were a component of the 1999 household survey. These originated as blank forms that the interviewers would fill out with the assistance of the interviewee, often the male head of the household, or jefe. The interviewers would ask the jefe about the types of land use or land cover (LULC) on his property, using a list of common natural and agricultural cover types as the basis for the questions. An outline of the finca was sketched, and each individual plot was delineated and labeled with the type of LULC and the number of hectares. Due to time constraints, these plots were not surveyed in, nor were their coordinates captured with GPS. Rather, these sketch maps represent the farmers mental map of his finca, and are considered fairly accurate, although they are not drawn to scale.
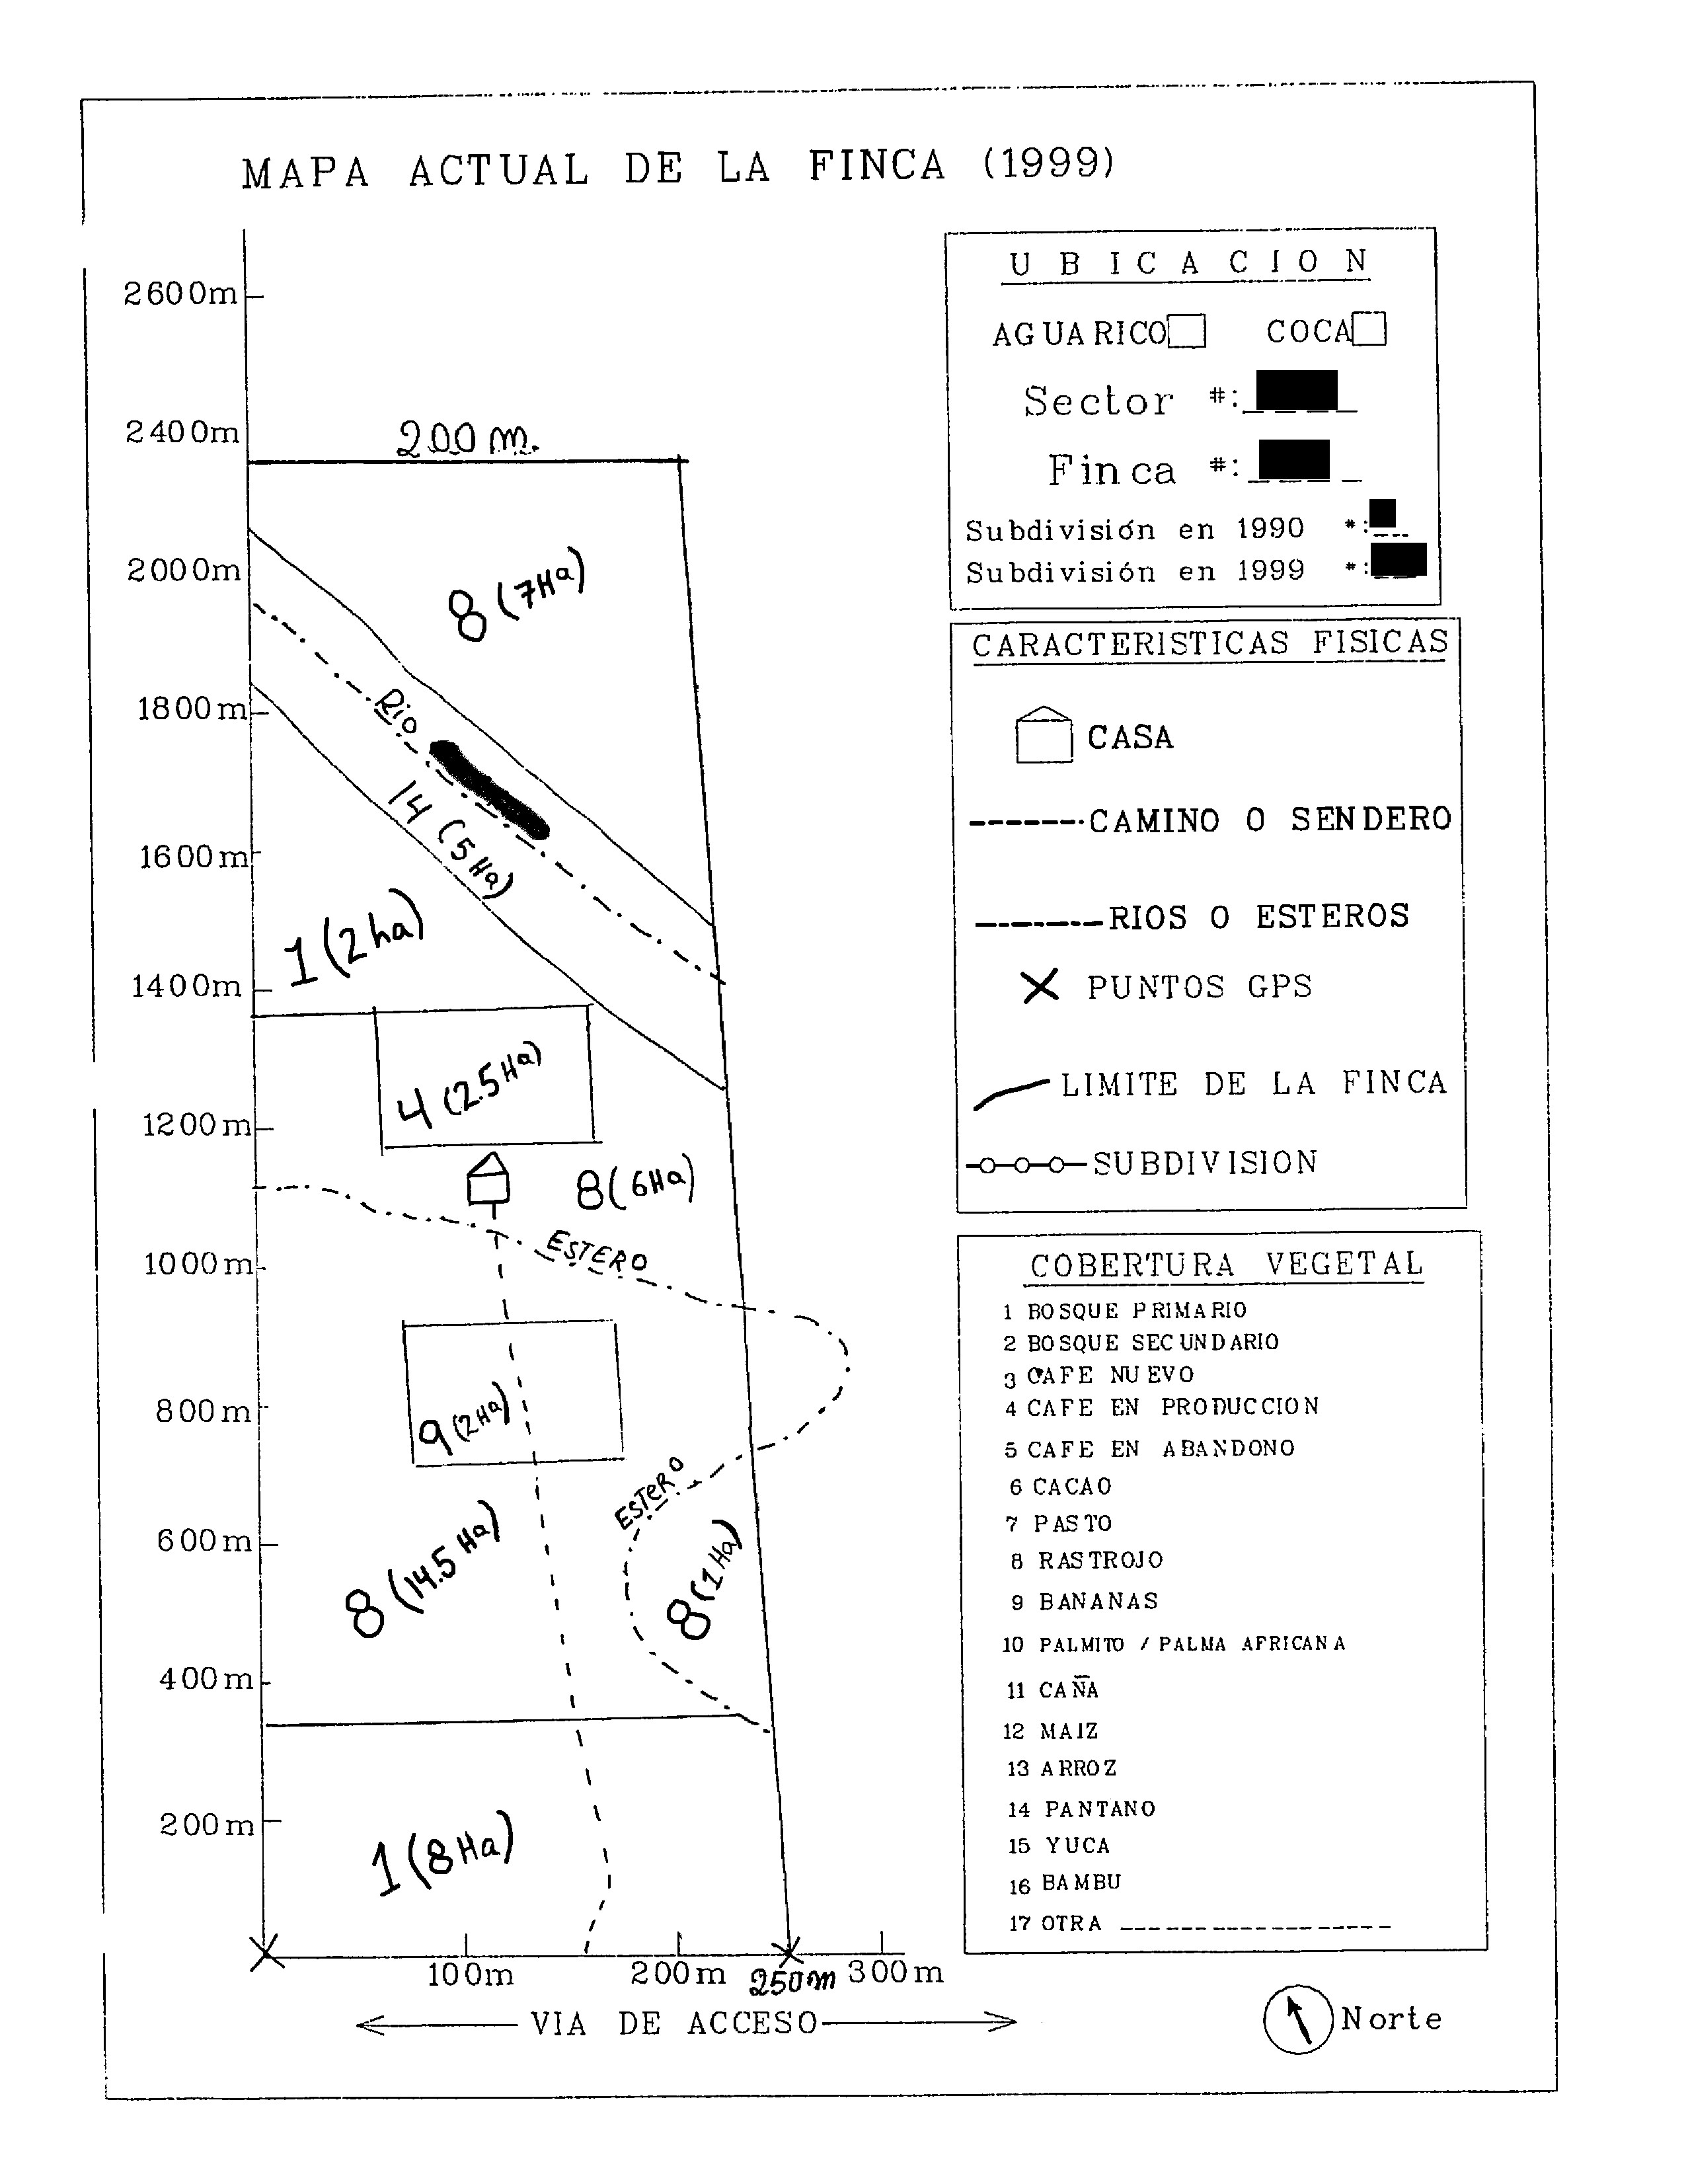
Example of a sketch map (locational information has been obscured). Click the image for a full view in JPEG format, or click here for PDF format.
The sketch maps have been used for a variety of purposes. They have been used as an aid in the delineation of the finca bounding polygons, as a comparative control for the reported LULC data in the survey data, and as a basis for locating areas of homogeneous LULC for the development of spectral training data for LULC classifications.